

Abstract
Combusting fossil fuels to produce electricity is the single largest contributor to sector-level, anthropogenic carbon pollution. Because sector-wide policies are often too unwieldy to implement, however, some researchers have recommended reducing electricity-based CO2 emissions by targeting the most extreme emitters of each nation's electricity industry. Here, we use a unique international data source to measure national disproportionalities in power plant CO2 emissions and estimate the fraction of each country's electricity-based CO2 emissions that would be reduced if its most profligate polluters lowered their emission intensities, switched to gas fuels, and incorporated carbon capture and storage systems. We find that countries' disproportionalities vary greatly and have mostly grown over time. We also find that 17%–49% of the world's CO2 emissions from electricity generation could be eliminated depending on the intensity standards, fuels, or carbon capture technologies adopted by hyper-emitting plants. This suggests that policies aimed at improving the environmental performance of 'super polluters' are effective strategies for transitioning to decarbonized energy systems.
Export citation and abstract BibTeX RIS
1. Introduction
As the global, fossil-fueled power sector has continued to grow, so too has the volume of carbon dioxide it emits into the atmosphere (International Energy Agency 2021). Over the past two decades, the electricity industry's CO2 emissions have risen by 53% worldwide (International Energy Agency 2021) and over half of all carbon releases are predicted to come from this sector in the future (Tong et al 2020). In the absence of an international cap-and-trade regime, several experts have argued that the next best approach for decreasing energy-related emissions is to set goals for electricity sectors' emission intensities, measured by the amount of CO2 emissions per megawatt (MWh) of electricity produced (Center for Clean Air Policy 2008, International Energy Agency 2009a, 2009b, Gerlak et al 2018). While agreeing that this sectoral approach would be easier to implement than nationwide CO2 emission caps, others suggest it is still insufficiently targeted because some facilities release vastly more pollutants than others. According to them, a country's emissions could be mitigated significantly and without greatly disrupting the overall economy or threatening industry survival by reducing the discharges of a small group of extreme polluters (Freudenberg 2005, 2006, Collins et al 2020, Grant et al 2020, Pulver and Manski 2021).
Research on disproportionalities in pollution has received growing attention in recent years. Scholars have examined how toxic releases are distributed unevenly within U.S. industries (Freudenburg 2005, Ash et al 2009, Collins 2012, Prechel and Istvan 2016, Collins et al 2020). They have also estimated reductions in particle pollution (PM2.5, SO2 and NOx ) within nations' coal-fired power sectors that could be achieved by targeting super polluting power plants (Tong et al 2018a). And they have shown how industrial hyper polluters in the United States disproportionately expose communities of color and low-income population to harmful chemical emissions (Collins et al 2016, Tessum et al 2019).
With respect to carbon pollution, some have suggested that the most effective way to address climate change is to take aim at the 'polluter elite,' individuals who own large shares of fossil fuel companies and/or are among the richest 10% of people in the world (Baer 2009, Chancel and Piketty 2013, Kennedy et al 2014). Others contend a better strategy would be to go after 'carbon majors,' the 100 companies responsible for supplying 70% of the world's fossil fuels (Heede 2014). Still other studies have examined organizations like power plants that directly burn and emit carbon. For example, researchers have analyzed disproportionalities in CO2 emissions within the U.S. coal-fired electric utility sector (Galli et al 2019, Robertson and Collins 2019) and China's power sector (Tong et al 2018b). Only two studies have assessed disproportionalities across fossil-fueled power plants' CO2 emissions within and between nations (Grant et al 2013, Jorgenson et al 2016), but their analyses are limited to 2009 when the world economy was in the grips of a financial crisis and the Paris Agreement had not yet been ratified.
Here, we use a newly constructed global database of individual power plants' CO2 emissions in 2018 to (a) reveal the locations and identities of the plants with the highest emission levels in the world, (b) compute changes in national disproportionalities in plant-level emissions from 2009 to 2018, and (c) calculate how much each country could lower its electricity-based CO2 emissions by improving the intensities, fuels, and technologies of its most extreme polluters.
2. Data and methods
Our database is an updated version of the 2009 Carbon Monitoring for Action (CARMA) file, the most widely used bottom-up inventory for allocating power plant CO2 emissions (Ummel 2012). The 2018 edition of CARMA draws on three data sets: plant-level emissions reports from the United States, European Union, Australia, Canada, and India 1 ; global plant- and company-level data from Platt's World Electric Power Plants Database; and country-specific power production data from the International Energy Agency. For non-reporting plants, CARMA estimates emissions using a statistical model fitted to data for the reporting plants and detailed data from the other two sources on plant-level engineering specifications.
The 2018 version of CARMA was constructed by the file's original architect, Kevin Ummel, and consists of 29 078 fossil-fuel power plants from 221 countries. Unobserved generation and emissions for fossil fuel power plants are estimated using statistical models fit to observable plant performance data, using plant-specific engineering and country-level power sector characteristics as predictor variables. Specifically, two predictive models are constructed: one to estimate a plant's capacity factor and one to estimate its CO2 emission factor (kgCO2 per MWh). In conjunction with known installed plant capacity (MW), these quantities allow estimation of annual electricity generation (MWh) and carbon dioxide emissions (CO2).
Annual plant performance is noisy and subject to outliers. To guard against undue outlier influence, the modified (median-based) Z-score test of Iglewicz and Hoaglin (1993) is used to remove observations that are deemed potential outliers (Z > 3.5) with respect to the response variable. After data preparation and outlier removal, there are 3,019 plant-level observations with observable annual capacity factor and 2,581 with observable CO2 emission factor.
Mean response models are fit for both capacity factor and emission factor using the gradient boosting machine (GBM) of Friedman (2001) as implemented by the R interface to the H2O.ai open-source machine learning platform. GBM models have a number of advantages relevant to an analysis of this type: (a) automatic selection from among available predictors, using ten-fold cross-validation to avoid over-fitting; (b) automatic detection of non-linear relationships and interaction effects (we allow up to third-degree interactions among predictor variables); (c) special treatment of missing values in the predictor data that would normally (e.g. in conventional OLS models) require dropping observations or multiple imputations. To further guard against undue outlier influence, the GBM models use the square root of total plant capacity as observation weights, putting greater emphasis on accurate modeling of larger plants that tend to exhibit less noise. In addition, mean absolute error (as opposed to canonical squared error) is used to define the stopping criteria for regression tree growth, which also tends to dampen the effect of potential outliers on overall model performance.
The capacity factor and emission factor response (dependent) variables are technically defined as ratios, relative to the expected capacity factor and emission factor, respectively, assuming a plant's generating capacity mimics national mean behavior for each fuel type. The denominators of the ratios are constructed by merging country- and fuel-specific mean capacity and emissions factors to each plant's individual generating units and then calculating the plant-level, capacity-weighted mean.
The predictor variables used by the GBM models are given in table 1. The 'importance' columns reflect the relative importance or influence of each predictor, following the technique of Friedman. Comparison of observed and predicted values for the observations used to train the GBM models indicates good overall performance. The capacity-weighted R2 for capacity factor (N = 3019) is 0.61 (0.58 unweighted). The capacity-weighted R2 for emission factor (N = 2581) is 0.92 (0.75 unweighted). The significant difference between weighted and unweighted R2 for emission factor reflects the considerable noise in emission factors for smaller plants, whereas larger plants tend to be fairly predictable.
Table 1. Predictor variables used in GBM models a .
| Predictor variable | Description | CF importance | EF importance |
|---|---|---|---|
| cf | Observed annual capacity factor | 0.501 | |
| pmover | Prime mover technology | 0.424 | 0.136 |
| cf_ratio | Ratio of observed capacity factor to expected mean value | 0.141 | |
| chp | Logical indicating combined heat and power | 0.147 | 0.048 |
| age | Mean generator age | 0.115 | 0.050 |
| fueltype_prime | Primary fuel type | 0.071 | 0.019 |
| bustype | Business type operating plant | 0.059 | 0.013 |
| steam_flow | Steam flow rate, if applicable | 0.042 | 0.016 |
| plant_cap_shr | Plant capacity as share of total capacity within country | 0.041 | 0.011 |
| plant_cap_shr_fuel | Plant capacity as share of total capacity of fuel type within country | 0.020 | 0.026 |
| plant_cap_rel | Plant capacity relative to mean capacity of all plants within country | 0.018 | 0.007 |
| plant_cap_rel_fuel | Plant capacity relative to mean capacity of fuel type within country | 0.016 | 0.008 |
| capacityMW | Total plant generating capacity (MW) | 0.020 | 0.005 |
| pgus | Number of generating units in plant | 0.011 | 0.005 |
| fueltype_other | Secondary fuel type | 0.004 | 0.008 |
| electricity_type | Type of plant operator | 0.005 | 0.004 |
| capacity_operational | Share of plant capacity that is operational | 0.006 | 0.001 |
aFor additional details, see http://docs.h2o.ai/h2o/latest-stable/h2o-docs/variable-importance.html.
One drawback of GBM models is the absence of standard techniques for estimating prediction intervals when predicting responses for new data. To provide an intuitive measure of uncertainty in the model estimates, prediction standard deviation is estimated using the variance model technique described in Milborrow (2012). This consists of modeling the modified absolute residuals of each GBM model as a non-linear GAM function (Pya and Wood 2015) of the predicted response value. After the GBM models make mean predictions for plants with unobserved capacity factor and/or emissions factor, the GAM variance models are then used to estimate the standard deviation associated with those predictions. The standard deviation can then be used to construct prediction intervals with the desired level of confidence.
S&P Global Plants' World Electric Power Plant Database (2018) does not include exact latitude and longitude coordinates for units. Nor do India and Australia report this information for their plants, which represent 13% (3813 of 29 265) of all cases. Two methods were employed to identify these missing coordinates. The first was to merge the relevant data from the original CARMA file, which contained some of these locations, into the updated power plant database, which covered 54.8% of cases (16 041 of 29 265). The remaining coordinates were identified according to their country, subnational, and city names with a Python forward geocoding program utilizing the Pandas and GeoPy libraries.
3. Results
3.1. The geographical distribution of super polluting power plants
Figure 1 displays the locations of the world's operative fossil-fueled power plants, their primary fuels, and the tons of carbon dioxide they released in 2018. Some past studies have defined super polluting power plants using intensity metrics (pollutants per unit of output or capacity) (e.g. Tong et al 2018a). Although this provides a straightforward way to compare the performance of operators of different sizes, we focus instead on total emissions because to contain global warming there must be severe cuts in emission levels. As the IPCC (Somanathan et al 2014) reports, to keep global warming to below 2 °C, we need to limit CO2 emissions to no more than 1000 GtCO2. This implies severe cuts to current emission levels—a 41% to 72% reduction by 2050. For this reason, we operationalize super polluting power plants in terms of the absolute volume of pollutants they emit. By the same token, we recognize that improving intensities might be one way to decrease emissions levels (assuming no rebounds) and therefore in a later section estimate how much super polluters' total amount of carbon pollution could be reduced if their carbon inputs were managed more efficiently (see also supplemental figure 1 available online at stacks.iop.org/ERL/16/094022/mmedia).
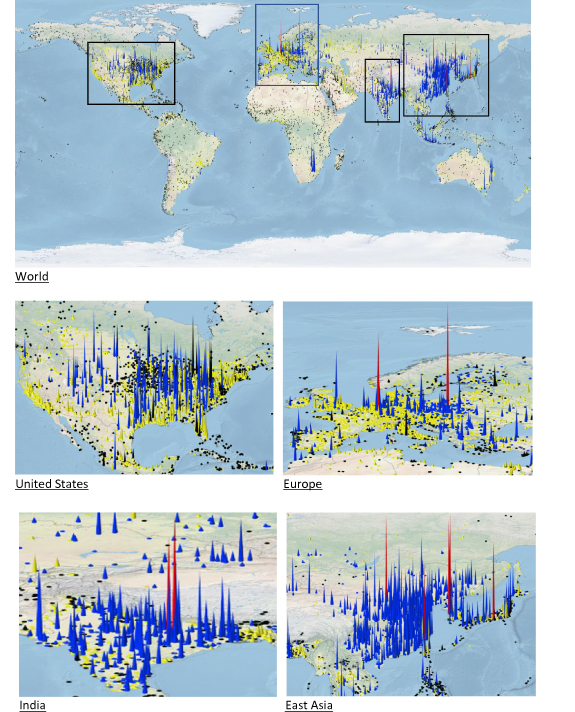
Figure 1. Maps of fossil-fueled power plants' CO2 emissions. Taller spikes indicate that plants emit CO2 at higher levels. Colors signify plants' primary fuels (blue = coal, yellow = natural gas, black = oil). Plants with red spikes are the world's ten biggest polluters (all of which rely primarily on coal).
Download figure:
Standard image High-resolution imageThe maps below reveal, as one might suspect, that the plants that did the most absolute damage to the atmosphere were fired by coal (indicated in blue). Most of these plants were clustered in the United States, Europe, India, and East Asia. As the map for the U.S. shows, their facilities with the highest emission levels tended to be fueled by coal and located in the eastern half of the country. Despite the U.S. having the largest economy, however, none of the world's ten worst polluting facilities were located within its borders.
Two of those worst plants were in Europe, as indicated in its map. The CO2 emissions of these facilities dwarfed those of their counterparts in the region. Turning to the map for India, we see two more of the planet's most extreme polluters. Their emission levels stood out from those of others in the country, though the differences between them were not quite as striking as observed in the European case.
The remaining six worst polluters are shown in the map for East Asia. Three of these facilities were closely situated in the southern portion of the Korean Peninsula. The others were in Japan, Taiwan, and northern China. These countries and in particular China had several major polluting coal plants in addition to these most extreme emitters. Still, the latter's CO2 levels were considerably higher than others in these areas.
As McAdam (2017) notes, one difficulty climate change activists have had in mobilizing action is identifying specific actors to blame for the escalating threats, creating the impression the climate crisis is largely the product of impersonal forces beyond our control. Table 2 reports the names and attributes of the ten worst polluting power plants shown in figure 1 and those of the most harmful in 2009. It reveals that five of the most extreme polluters in 2018 were also among the most profligate nearly a decade earlier, though their ranking changed with Poland's Belchatow plant supplanting the Taichung facility as the very worst. To put the enormity of these two plants' carbon pollution in perspective, in both years they each emitted more carbon dioxide than the entire country of Switzerland 2 .
Table 2. Top ten polluting power plants in 2018 and 2009 a .
| 2018 | |||||||
|---|---|---|---|---|---|---|---|
| Rank | Plant name | Country | Tons of CO2 | Primary Fuel | Age | Capacity | Relative Intensity |
| 1 | Belchatow | Poland | 37 600 000 | Coal | 27 | 5298 | 1.756 |
| 2 | Vindhyachal | India | 33 877 953 | Coal | 14 | 4760 | 1.485 |
| 3 | Dangjin | South Korea | 33 500 000 | Coal | 10 | 6115 | 1.473 |
| 4 | Taean | South Korea | 31 400 000 | Coal | 12 | 6100 | 1.481 |
| 5 | Taichung | Taiwan | 29 900 000 | Coal | 22 | 5834 | 1.282 |
| 6 | Tuoketuo | China | 29 460 000 | Coal | 10 | 6720 | 1.450 |
| 7 | Niederaussem | Germany | 27 200 000 | Coal | 38 | 3826 | 1.451 |
| 8 | Sasan Umpp | India | 27 198 628 | Coal | 3 | 3960 | 1.401 |
| 9 | Yonghungdo | South Korea | 27 000 000 | Coal | 9 | 5080 | 1.481 |
| 10 | Hekinan | Japan | 26 640 000 | Coal | 21 | 4100 | 1.394 |
| 2009 | |||||||
| 1 | Taichung | Taiwan | 36 336 000 | Coal | 13 | 5834 | 1.172 |
| 2 | Poryong | South Korea | 32 823 000 | Coal | 13 | 5954 | 1.149 |
| 3 | Taean | South Korea | 30 347 000 | Coal | 3 | 4100 | 1.310 |
| 4 | Belchatow | Poland | 29 500 000 | Coal | 18 | 4340 | 1.448 |
| 5 | Dangjin | South Korea | 29 046 000 | Coal | 2 | 4075 | 1.244 |
| 6 | Hadong | South Korea | 28 719 000 | Coal | 7 | 4000 | 1.259 |
| 7 | Niederaussem | Germany | 26 300 000 | Coal | 29 | 3826 | 1.186 |
| 8 | Mailiao Fp | Taiwan | 25 304 000 | Coal | 8 | 4200 | 1.074 |
| 9 | Vindhyachal | India | 24 812 000 | Coal | 5 | 3260 | 1.207 |
| 10 | Kendal | South Africa | 24 652 000 | Coal | 18 | 4374 | 1.335 |
aRelative Intensity is the ratio of the plant's intensity to the average intensity for all fossil-fueled plants in that plant's country.
Importantly, the last column shows that the ten worst plants' intensities (emissions per unit of generated electricity) exceeded those of other fossil fuel power plants in their home countries. Specifically, in 2018, they emitted carbon at a rate 28.2% to 75.6% higher than their counterparts. This indicates that the top ten polluters' higher emission levels were not just the result of their greater output. Rather they also burned inputs less efficiently and/or used more carbon-intensive fossil fuels. Why these relatively inefficient plants are used so heavily is a topic ripe for future investigation.
3.2. National and global disproportionalities in power plant CO2 emissions
In keeping with Freudenberg's (2005, 2006) seminal writings on hyper-emitters, table 2 measures national and global disproportionalities in power plant emissions using Gini coefficients. While a Gini coefficient typically ranges from 0 to 1, we multiplied the coefficient by 100 to aid in interpretation, a common approach when studying such measures. Thus, a value of 100 would indicate that a single power plant produced all carbon emissions in a given sector (perfect inequality), whereas a value of 0 would indicate that all power plants emitted an equal amount (perfect equality).
Table 3 shows that in each of the ten countries that generated the most carbon pollution in 2018, the distribution of emissions across their plants was severely unequal, though less so in the top polluting nation of China. Disproportionalities were still large even after considering differences in plants' electrical output by weighting each plant by the reciprocal of plant-level output, the sole exception being the case of South Africa 3 . Moreover, when comparing unweighted and weighted disproportionalities in 2018 with earlier ones in 2009, we find that these disparities have generally widened over time at the national and world levels. Skewness and range statistics also suggest that more countries' Gini scores have moved to extreme positive end of the distribution over time.
Table 3. Gini coefficients for disproportionality in plant-level CO2 emissions for the ten nations with the highest CO2 emissions from fossil fuel power plants a .
| Rank | Country | GINI (2018) | Weighted GINI (2018) | GINI (2009) | Weighted GINI (2009) | |
|---|---|---|---|---|---|---|
| 1 | China | 60.6 | 39.6 | 59.6 | 35.8 | |
| 2 | United States | 92.4 | 50.9 | 86.1 | 49.8 | |
| 3 | India | 84.9 | 54.3 | 84.9 | 47.0 | |
| 4 | Japan | 95.7 | 46.9 | 95.5 | 43.6 | |
| 5 | Russia | 77.5 | 48.7 | 71.7 | 51.2 | |
| 6 | South Korea | 93.7 | 48.1 | 92.1 | 39.6 | |
| 7 | Germany | 95.6 | 61.2 | 92.9 | 55.3 | |
| 8 | South Africa | 81.0 | 16.8 | 77.6 | 13.7 | |
| 9 | Australia | 94.9 | 55.2 | 93.8 | 41.6 | |
| 10 | Indonesia | 84.9 | 56.5 | 90.5 | 56.8 | |
| World | 91.8 | 54.9 | 89.8 | 52.5 | ||
| Mean | S.D. | Skewness | Range | |||
| GINI (2009) | 68.0 | 18.6 | −695 | 2.6–96.4 | ||
| GINI (2018) | 63.9 | 21.2 | −489 | 2.3–97.4 | ||
| Weighted GINI (2009) | 28.7 | 13.8 | 024 | 1.2–56.8 | ||
| Weighted GINI (2018) | 31.2 | 14.3 | 170 | 1.4–63.8 | ||
aWeighted Gini weights each plant by plant-level output, measured as net megawatt-hours generated in a year.
Figure 2 explores this possibility in more detail. Specifically, it reports the relative over- and underrepresentation of countries' 2018 weighted Gini coefficients with the respect to the distribution of countries' coefficients in 2009 (Jann 2021). A 2018 coefficient larger than one means that countries' 2018 coefficients are overrepresented at the corresponding level of 2009 coefficients, values lower than one mean that the 2018 coefficients are underrepresented relative to 2009. As the figure reveals, the largest distributional differences are at the top of the distribution. Countries' 2018 coefficients are overrepresented by nearly a factor of 3 in the uppermost quantile, suggesting that countries with extreme disproportionalities have become more common between 2009 and 2018.
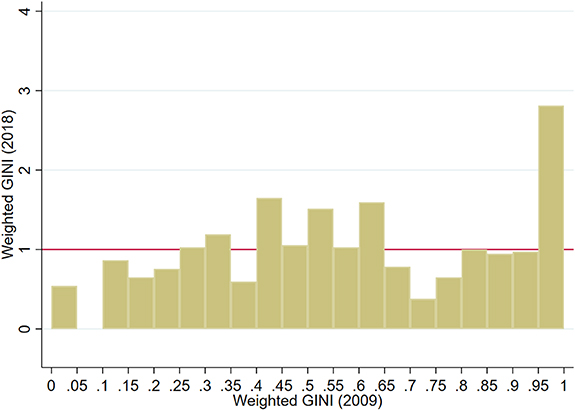
Figure 2. Distributional differences in countries' weighted Gini scores, 2009–2018.
Download figure:
Standard image High-resolution image3.3. Extreme polluters' shares of CO2 emissions and mitigation opportunities
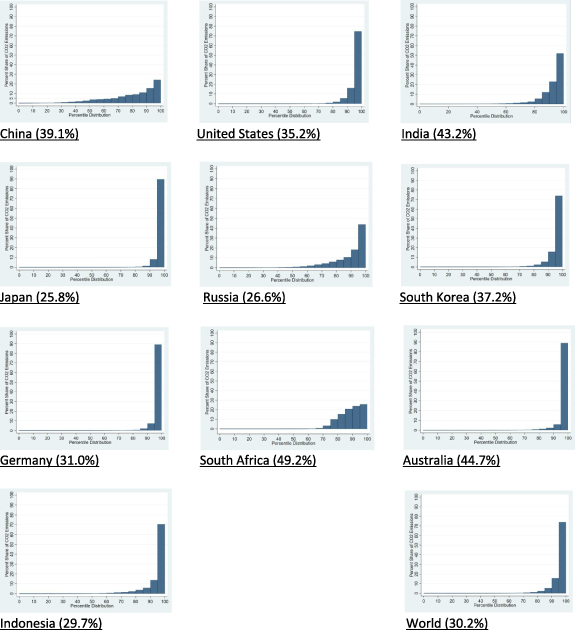
While Gini coefficients indicate the overall pollution inequality across a distribution of plants, they fail to capture the portion of a country's CO2 level generated by its most extreme emitters. The histograms in figure 3 address this issue. It shows the share of a country's total 2018 (unweighted) electricity-based emissions that came from the top 5% of its polluting power plants. The graphs reveal that in China, its extreme polluters accounted for 24.5% of total emissions or nearly five times more than would be expected if emissions were distributed evenly across plants. Whereas in other countries like the U.S., Japan, South Korea, Germany, and Australia, where the distribution of pollution was more extremely skewed, the top 5% of their polluters were responsible for 75%–89.6% of all emissions or roughly 15–18 times more than would be expected if emissions were evenly distributed. For the world as a whole, its top 5% percent of polluters contributed 73% of all electricity-based CO2 discharges or 14.6 times more than if pollutants were evenly dispersed.
Figure 3. Percent shares of electricity-based CO2 emissions. Percent of total CO2 emissions stemming from the electricity sector indicated in parentheses.
Download figure:
Standard image High-resolution image
Having shown that a large swath of emissions can be attributed to a small group of extreme polluters, we now consider how much would nations' and the world's total CO2 emissions be cut if policymakers focused only on improving the intensities of these facilities. Specifically, table 4 reports how much emissions could be reduced if a country's top 5% of polluters lowered their intensities to the average for fossil fuel plants in their sector (column 1), lowered their intensities to the average for the world's entire fleet of fossil fuel plants (column 2), switched fuels from coal and oil to gas (column 3), and by incorporating technologies capable of capturing and storing 85% of carbon emitted per unit of electricity generated (including the energy penalty associated with capturing and storing emission—International Panel on Climate Change 2005) (column 4).
Table 4. Percentage changes in electricity-based CO2 emissions if the top five percent of polluters adopted certain intensity standards, fuels, or technologies.
| (1) | (2) | (3) | (4) | ||
|---|---|---|---|---|---|
| Rank | Country | If top 5% lowered their intensities to their sector's average for fossil fuel plants | If top 5% lowered their intensities to the World's average for fossil fuel plants | If coal and oil plants in top 5% switched to gas | If top 5% incorporated carbon capture and storage |
| 1 | China | −3.80% | −9.60% | −11.13% | −20.70% |
| 2 | United States | −29.30% | −29.50% | −41.71% | −63.70% |
| 3 | India | −8.40% | −20.40% | −23.57% | −44.20% |
| 4 | Japan | −39.20% | −35.20% | −43.06% | −76.10% |
| 5 | Russia | −20.90% | −17.40% | −34.13% | −37.60% |
| 6 | South Korea | −40.00% | −32.70% | −39.26% | −76.00% |
| 7 | Germany | −55.90% | −35.10% | −43.71% | −75.90% |
| 8 | South Africa | −8.60% | −11.60% | −13.30% | −25.20% |
| 9 | Australia | −28.30% | −34.90% | −42.88% | −75.50% |
| 10 | Indonesia | −9.00% | −28.00% | −33.38% | −60.50% |
| World | −16.81% | −25.40% | −29.50% | −48.90% |
Results indicate that in China whose worst polluters emit a comparatively small share of that country's total CO2, targeting these facilities would yield gains ranging from 3.1%, if it reduced their intensities to their electricity sector's average for all fossil fuel plants to 20% if all of its extreme polluters were equipped with carbon capture systems. In contrast, in a country like the United States, where extreme polluters account for a much larger share of that nation's carbon pollution, the gains would be considerably more substantial. Depending on the change adopted, targeting super polluters would reduce overall emissions between 29.3% and 63.7% in the U.S. Although the advantages of targeting extreme emitters vary by country, as table 4 shows, if all nations were to enforce the changes considered here, the world's total electricity-based CO2 emissions could be reduced by as much as 29.50% should extreme emitters be required to use gas (the most available and efficient mitigation option) and 48.9% should they be required to incorporate carbon capture systems 4 .
4. Conclusion
Contrary to the received wisdom that greater environmental harm is a function of greater economic activity, emerging scholarship suggests that polluting releases are disproportionally distributed across units of production. In this paper, we have sought to advance our understanding of how electricity's climate-disrupting emissions might be reduced by applying a disproportionality approach to the world's fleet of fossil-fueled power plants. Findings suggest that instead of relying on sweeping environmental initiatives, substantial environmental progress can be made through selectively targeting nations' hyper-polluters—the worst-of-the-worst—that are responsible for the lion's share of their carbon pollution. As the fossil-fuel-burning energy infrastructure continues to expand and the urgency of combating climate change grows, nations will likely need to consider more expedient strategies of this sort.
As our results indicate, focusing on the most extreme polluters would yield varied benefits for nations. Therefore, no single disproportionality policy will fit all. In countries where larger emitters are difficult to regulate, it may be more effective to target a greater number of smaller plants. For example, in nations like China that have numerous mid-sized plants and therefore exhibit less disproportionately, it may be prudent to expand the range of targeted facilities from, say, the top 5% to the top 10%. Whatever the case might be, this study suggests that policies aimed at a small subset of super polluters should be considered alongside sector- or economy-wide approaches.
As is the case with similar studies, our inquiry is subject to shortcomings. We had to estimate the CO2 emissions of plants that were not required to report such discharges. Nor was it possible to obtain or verify all of the emissions reported to nations, some of which are proprietary. Although data on individual plants' installed capacities are readily available, that was not the case with unit-based fuel consumption and annual operating hours, which are also needed to determine a facility's electrical productivity. Therefore, the latter often had to be estimated and some smaller plants may not have been included in our data sources.
Nonetheless, as we explained in the data and methods section and footnote 2, our estimated emissions and output are most reliable for the largest power plants, which were the focus of this paper. Efforts are also underway to track and verify emissions from plants and other sources using, for example, satellite monitoring systems (Couture 2020, Liu et al 2020). And as countries come to recognize their common fate in addressing climate change, hopefully, more data will be collected, standardized, and shared 5 .
In future research, we plan to investigate how regulators might exploit the mitigation opportunities revealed here by retiring plants, improving efficiencies, enhancing the quality of fossil fuels inputs, and adopting various abatement measures. We will also examine how policies can help expedite such changes and thus level differences in plants' emissions. We have matched information on decommissions, emission controls, and policies to the power plants examined here as part of a larger dataset that will soon be made publicly available.
Data availability statement
The dataset in this study is available from the corresponding author on reasonable request.
The data that support the findings of this study are available upon reasonable request from the authors.
Footnotes
Funding provided by the National Science Foundation, Award # 1824 106.
- 1
The US Environmental Protection Agency's eGRID database is available online at www.epa.gov/cleanenergy/energy-resources/egrid/index.html. The European Pollutant Emission Register is available online at http://eper.ec.europa.eu/eper/flashmap.asp. Australia provides information on electricity sector emissions at www.cleanenergyregulator.gov.au/NGER/National%20greenhouse%20and%20energy%20reporting%20data/electricity-sector-emissions-and-generation-data/electricity-sector-emissions-and-generation-data-2018-19. Environment Canada provides greenhouse gas emissions reports at www.ec.gc.ca/pdb/ghg/onlinedata/DataAndReports_e.cfm. The Indian Power Ministry reports emissions at www.cea.nic.in/planning/c%20and%20e/Government%20of%20India%20website.htm.
- 2
The procedures used to assess the reliability of CARMA estimates are detailed in Ummel (2012). In general, models suggest that nearly 70% of global CO2 emissions come from plants with absolute prediction error (APE) < 20% and more than 85% come from plants with APE < 40%. This is because predictions are especially reliable for the types of large plants shown in table 2. For example, models suggest that we can state with a high degree of confidence that the plants from non-reporting countries listed in this table (under panel 2018) are all extreme emitters. The 90% prediction intervals for these six plants are 24 500 000–55 000 000 (Dangjin), 25 590 000–57 110,00 (Taean), 25 310 000–56 900 000 (Taichung), 25 720 000–53 850 000 (Tuoketuo), 17 060 000–41 060 000 (Yonghungdo), and 12 450 000–30 500 000 (Hekinan). By the same token, because their emissions are predictions and, in some cases, close to one another, these facilities' relative ranking is less certain.
- 3
The relative high Gini for the U.S. contrasts with the findings of Galli and Collins (2019) that suggest disparities in coal-fired plants' CO2 emissions are small after accounting for differences in their electrical output. We suspect part of the discrepancy may be because our analysis also includes plants fueled by oil and natural gas.
- 4
In other analyses not reported here, we estimated what would happen if intensities were reduced to the average for coal, oil, and gas plants and found their effects would be minimal. Respectively, they would only reduce the world's electricity-based emissions by 3.0%, 1.4%, and .4%.
- 5
Some might also fault our study for not examining the disproportionate pollution caused by power plants' parent companies (see Galli et al 2019). While investigating the role of these companies is obviously important, unfortunately, international data on facilities' parents is missing for many countries.